Go Back
Quick Links
Quick Start Guide
This section
guides you through a simple Blood Pressure
Tracker session. You will navigate
through the common functions to create and view your health information. For help on advanced features go to
the Detailed Functionality section. |
|||||||||||||
|
|
|||||||||||||
Recording
a Blood Pressure Reading
You have just taken your blood pressure, what do you do?
Your data will be more accurate if you record your reading in your tracker as soon as possible. It is essential to remember any symptoms or possible triggers to gain insight into your blood pressure. |
|||||||||||||
|
|
|||||||||||||
|
|
|
|
|||||||||||
|
|
|||||||||||||
Finding your Blood Pressure PatternsYou have entered several days of blood pressure readings. You want to see if you recognize any patterns in your life so that you can try and manage your blood pressure better. The Blood Pressure Tracker Reports will help you do this. The report analysis will not be useful unless you have a few blood pressure readings entered and your data is accurate. For accuracy, remember to record your data as soon as you can. |
|||||||||||||
|
|
|||||||||||||
|
|
|
|
|||||||||||
|
|
|
|
|||||||||||
|
|
|
|
|||||||||||
|
|
|||||||||||||
|
|
|||||||||||||
Detailed Functionality
|
|||||||||||||
|
|
|||||||||||||
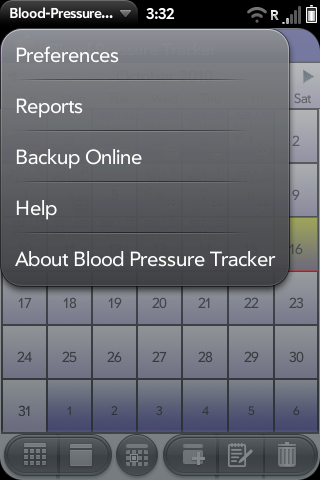
The Menu
The Blood Pressure Tracker menu is
available by pressing the top left arrow by the Blood Pressure Tracker program name.
The following table lists the options available through the main menu. |
|||||||||||||
|
|
|
||||||||||||
|
Blood Pressure Tracker
Menu |
|
||||||||||||
|
|
|||||||||||||
The
following table lists the buttons and their functionality found in the Blood Pressure Tracker application.
|
Button |
Functionality |
|
|
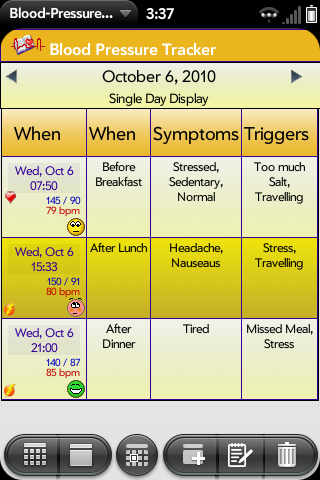
List View Pressing this button
displays the “List View” of the health information. |
|
|
Calendar View Pressing this button displays the
“Calendar View” of the health information. |
|
|
Today Pressing this button
puts the user on Today’s date. |
|
|
Add New Pressing this button takes the user
to the “Add New” information screen.
The user will add health information for the selected date. |
|
|
Edit Information Pressing this button
takes the user to the “Edit” information screen. The user is able to edit the previously
added health information for the selected date. |
|
|
Delete Pressing this button deletes the
previously added health information for the selected date. You will be asked to confirm your action
before it is deleted. |
|
|
Exit Scene Pressing this button
takes the user back to the previous scene without saving any changes. |
|
|
Save Pressing this button saves the
added or changed health information. |
|
|
Help Help is available nearly
everywhere. Press this to get
detailed help whenever needed. |
|
|
|
|
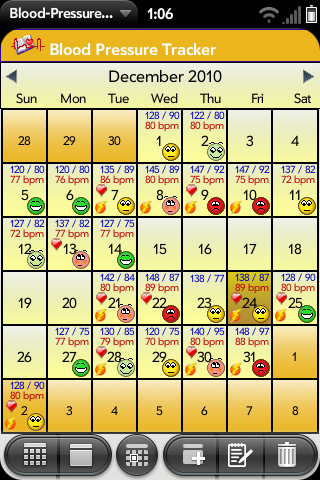
Calendar View To customize the look & feel of the calendar, select the
Preferences option from the menu |
List View To customize the fields that display in this list, select
the Preferences option from the menu |
|
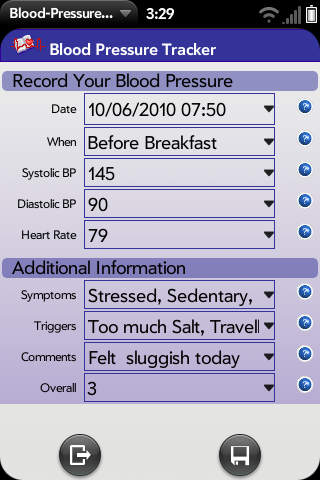
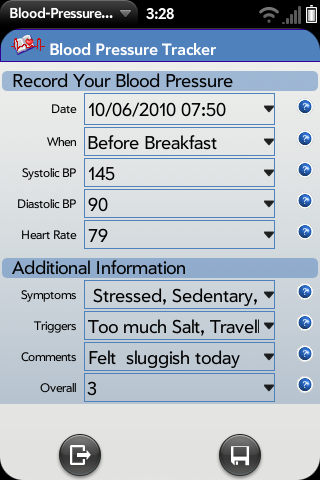
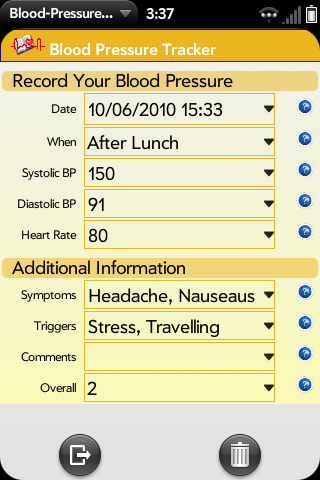
To add new
blood pressure information for the current day, select the date by highlighting the
date from the Calendar View then press this add button. The following “Add”
information screen is displayed.
Enter the blood pressure information and then press “save”. |
|
|
|
Enter the date and time of your blood pressure reading.
|
|
When |
Enter when your reading was taken. |
|
Systolic BP |
Enter your Systolic BP.
|
|
Diastolic BP |
Enter your Diastolic BP.
|
|
Heart Rate
|
Enter your heart rate.
|
|
Symptoms |
On a scale of 1 to 10, how bad or how good do you feel?
|
|
Triggers
|
Select all triggers that could effect your reading. It is essential that you select everything
that occurred within 24 hours of the reading.
This will help you identify possible triggering events of your BP levels.
|
|
Comments
|
Enter additional remarks regarding this attack.
|
|
Overall
|
Overall how do you feel?
|
|
|||||||||||||||||||||||||||||||||||||||||||||||||
|
|
|
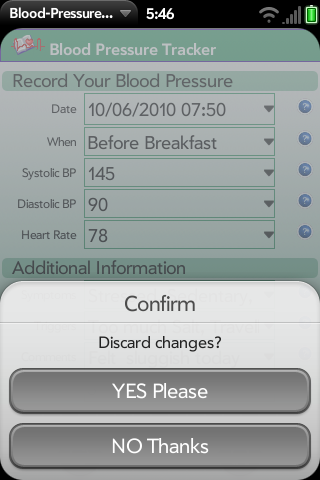
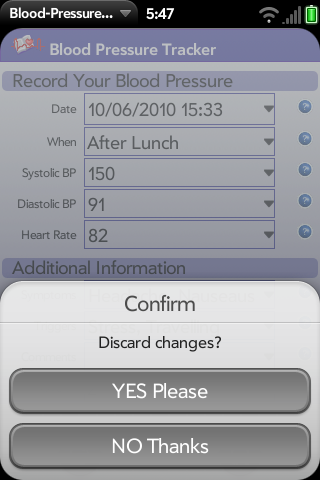
Editing Entering blood pressure information |
Saving You will be asked to confirm your action if you discard
before saving your changes |
|
|
|

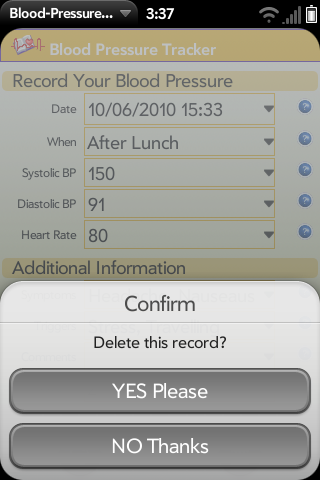
Deleting
To
delete information for the current day, select the date by highlighting the
date from the Calendar View or List View and then press this delete
button. You will be asked to confirm
your action before it is deleted. |
|
|
|
|
|
Deleting Select the “Trashcan” button to
delete the selected blood pressure information |
Confirmation You will be asked to confirm
your action before the entry is deleted |
|
|
|
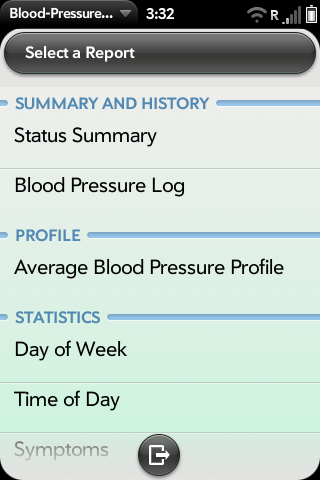
Reports
Reports are available by pressing the reports option from the top
left arrow by the Blood Pressure Tracker
program name. After you make your
report selection, you will enter the desired date range for your report. The
following lists the blood pressure reports available. |
||
|
|
||
|
|
|
|
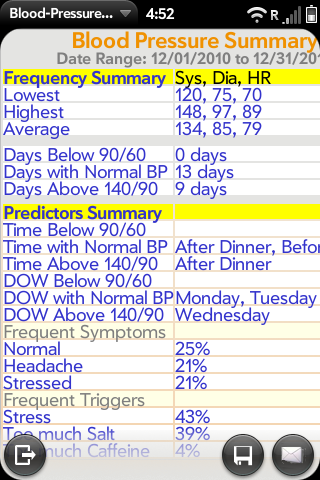
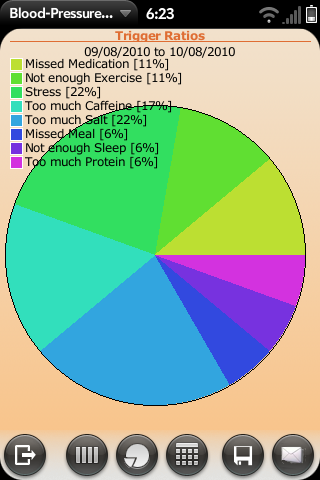
Summary
|
The “Status Summary” report summarizes your blood pressure information in one
report for the given date range. It
determines your predictors for your blood pressure levels. It calculates your minimum, maximum and average
systolic, diastolic and heart rate over the given date range. Additionally, the most frequent triggers and
symptoms are listed. Since this report identifies your triggers
and frequency patterns, it will be most helpful in managing
your blood pressure.
|
|
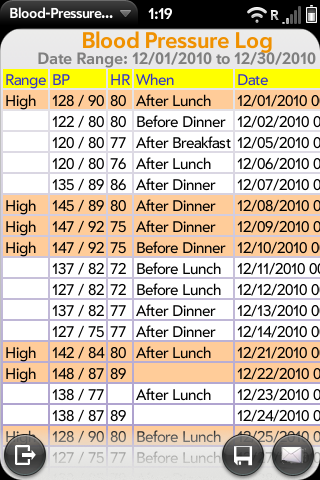
Blood Pressure Log |
The “Blood Pressure Log” lists your BP readings for the given date range. The readings are color coded to help identify issures. |
|
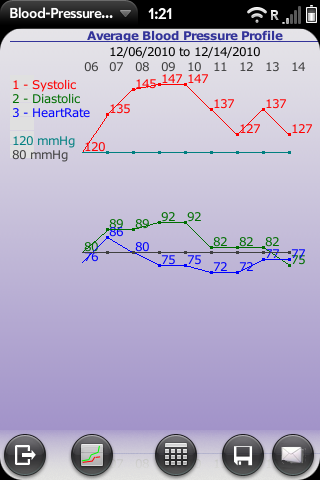
Profile
|
The “Average Blood Pressure Profile”, provides you with a linear graph of your average blood pressure and heart rate values. You can see your highs and lows in the given date range. |
|
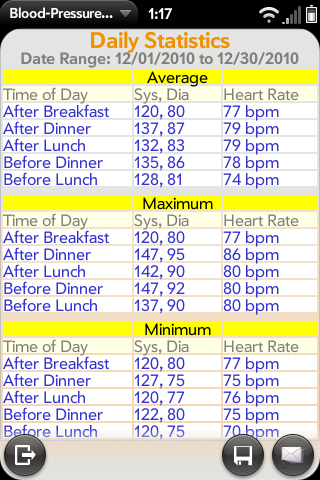
Statistics |
The “Statistics” reports are useful tools that show you numerous statistics including overall average, minimum, maximum, weekly and daily distributions. |
|
|
||
|
|
||
|
|
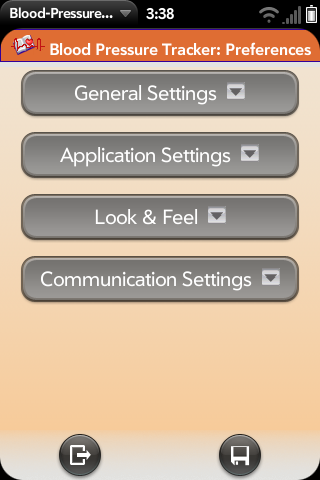
There are four Preference
sections. In the “General Settings” drawer you have access to the
password protection and date formats. In the “Application Settings” drawer you can access the
“Reset Data” function as well as managing your customizable drop down lists. In the “Look & Feel” drawer you can access your color
theme and what visual indicators or data appears on your calendar and
lists. In the “Communication Settings” drawer you can access your
cellHigh Online Account Credentials. |
|
|
|
||
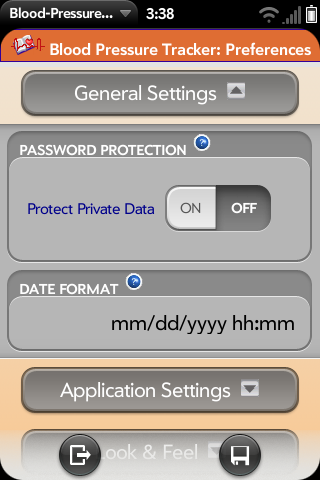
General
Settings
|
||
|
Password
Protection Tap the “ON” button to enable password
protection for your data. If
you enable password protection you will be prompted for the password. There are no restrictions on password
length or content. Remember this
password, as you will be prompted for this password each time you start your
application. To disable
the password protection just press the “OFF” button. Date
Format Select the correct date format for
your region from the drop-down list. |
|
|
|
|
||
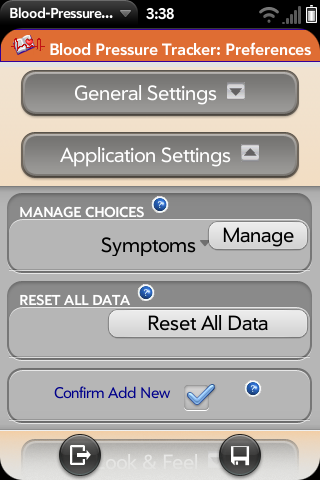
Application
Settings
|
||
|
|
Manage
Choices The Manage Choices section allows you
to add data to and edit your customizable drop-down lists. All lists that appear in your tracker can be
added to through this option. For
instance, if you have a particular “Symptom” that does not appear in the
list, you can add it here. When you
add information to your tracker, you can also at that time add new entries to
these lists. These entries can be
edited and deleted here also. Reset
All Data If you want to erase all of your data
and start new, you can do this by pressing the “Reset All Data” button. Since there is no way to reverse this
process, you will be asked to confirm if you really want to do this. NOTE: you can not undo this action, so be
careful and make sure that you do not want the data that is currently in your
tracker. |
|
|
|
|
|
|
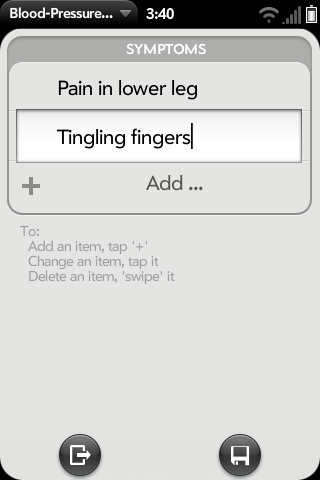
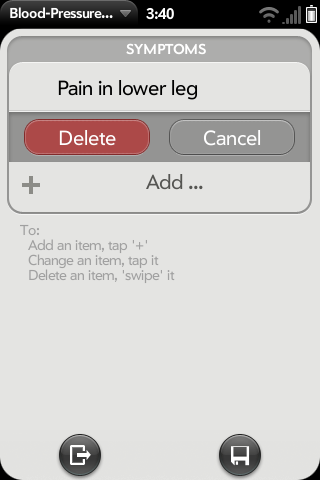
Manage Choice List Adding symptoms to the Symptoms List.
To Add an item, you tap the ‘+’. To Change an item, you tap it; To Delete
an item, you ‘swipe’ it and the Delete appears (following figure) |
Deleting an Item Deleting a symptom from the Symptoms List |
|
|
|
||
Look
& Feel
|
||
|
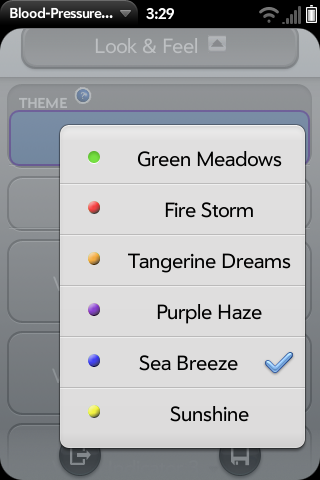
Theme Customize your tracker look by choosing
from one of the six color themes. Display
Emoticon You have the ability to select an
emoticon that represents an overall feeling about each entry in your
tracker. These emoticons appear on your
calendar and list views. If you don’t
want them to display, uncheck the display emoticon checkbox. Visual
Indicators Visual Indicators help you understand your
data. They represent an event that
occurred on a specific day. These
settings allow you to select which event and associate an icon with that
event. Text
Indicators The text that displays on your
calendar can be turned on or off here. List
View Fields The information that displays on the
List View, can be changed from here. |
|
|
|
|
||
|
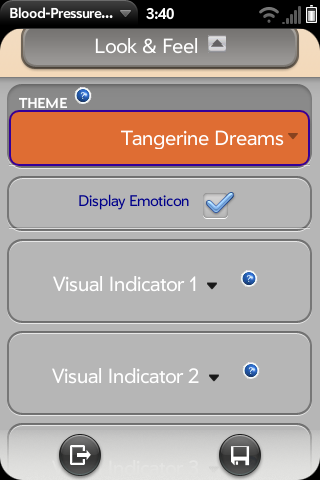
Theme In the Preferences, Look & Feel drawer, you can customize your look
by choosing from six color themes. |
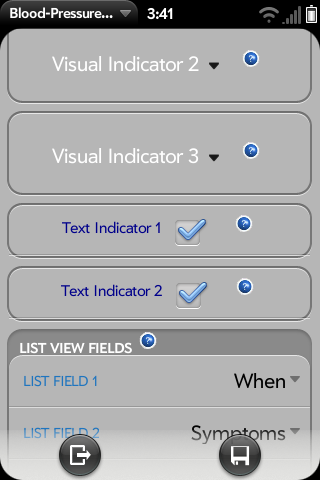
Text Indicators In the Preferences, Look & Feel drawer, you can turn off the display
of the text that displays on your calendar.
“Text Indicator 1” displays the latest blood pressure of that day. “Text Indicator 2” displays the latest
heart rate of that day. |
|
|
|
||
|
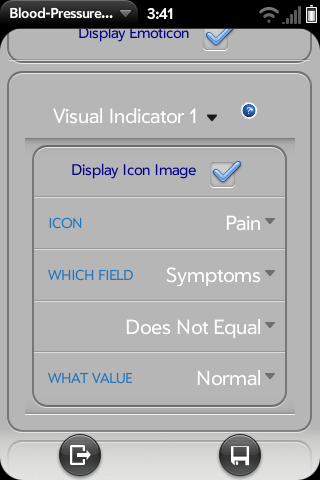
Visual Indicators You can customize 3 visual indicators that display in your tracker |
Visual
Indicators Visual Indicators help you understand
your data. They represent an event
that occurred on a specific day. These
settings allow you to select which event and associate an icon with that
event. You can display up to 3 visual
indicators on your tracker. For each visual indicator, you select
which icon to display if the condition specified is true. To specify the event, you must select the
field, operator and value of the event.
In the example to the left, the “Pain” icon will display if the
“Symptom” field equals any value other than “Normal”. This indicates that you have abnormal symptoms on that
day, so the “Pain” icon appears. |
|
|
|
|
|
|
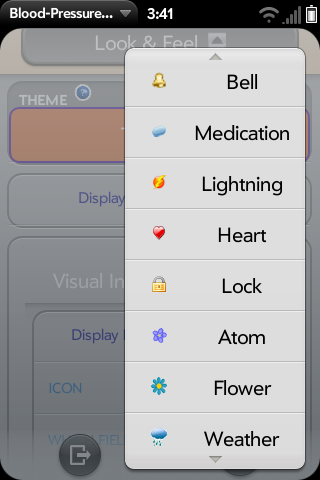
Visual Indicators: Icon List In the
Preferences, Look & Feel drawer, you can customize your look by choosing
from several visual indicators |
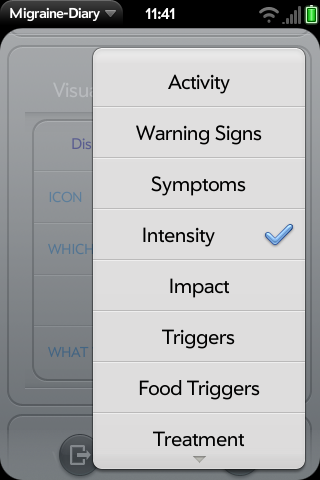
Visual Indicators: Field List In the
Preferences, Look & Feel drawer, you can select the field that will
trigger the visual icon to display on your calendar |
|
|
|
|
|
|
|
||